

Using open data to power Georgia’s healthcare workforce
Georgia Board of Health Care WorkforceUsing the DKAN open source open data platform, we built tools to help Georgia decision-makers plan for a resilient healthcare workforce.
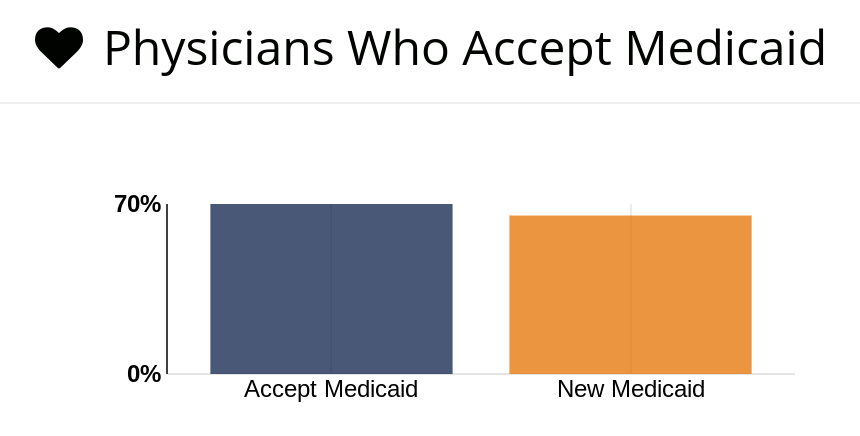
 The dashboards are searchable by county and by practitioner type.
10.5M
Georgians served by healthcare data
159
counties represented
20
published articles promoting the data visualization tool
“This collaboration birthed the interactive workforce analysis tool which — for the first time in the State — allowed legislators and workforce advocates to view healthcare workforce data online for free.”
Leanna Greenwood | Senior Data Analyst, GBHCW
The challenge
The Georgia Board of Health Care Workforce (GBHCW) serves communities in the state with a focus on medically underserved areas. The agency provides data reports on the physician, physician assistant, and nurse workforce and funds loan repayment programs to recruit healthcare workers to underserved parts of the state. However, healthcare workforce planners were having trouble estimating and meeting demand for practitioners across counties --especially as the COVID-19 pandemic drew many of them out of Georgia and into various hotspot states. Additionally, without publicly-available data on healthcare workers, GBHCW struggled to inform medical facilities with potential funding and staffing needs."
The agency saw an opportunity to leverage the DKAN open data platform where they were already hosting their data, combined with custom data services from our team. We worked with GBHCW to create data visualizations and tools that make it easy for staff, medical practitioners, and the public to access the information needed to build a resilient and responsive state healthcare workforce.
Client goal
We were tasked with crafting detailed, easy-to-read visualizations for data provided by the Georgia Composite Medical Board and the Georgia Board of Nursing. We also built robust, multifunctional dashboards that allow data to be searched across physicians, physician assistants, and nurses. The dashboards needed to:
- Host and display data resources with user needs in mind
- Show the number of licensed healthcare practitioners in a given area
- Display data in a clear, user-friendly, and accessible way
- Be easily adaptable and sustainable with the constant influx of new data
- Reflect diverse intersections within the data (gender, race, qualifications, etc.)
- Help legislators make data-based decisions to improve the healthcare field
Expertise
- Data Visualization & Dashboards
- Informed Research Methods
- Data Cataloguing
- Helpdesk Support
- Visual Design
- Data Maintenance
- Information Architecture
- Content Strategy
- API Design & Deployment
- Agile Methodologies
- Data Tidying
Tools and technologies
- DKAN/DKAN2
- React
- D3.js
- Google Analytics
- Vega
Our approach
Because other state agencies were already using the open source Drupal framework to publish and manage government content, GBHCW chose the Drupal-based open data platform DKAN for their data dashboards. The agency also saved time and money by utilizing an existing contract with us, adding new digital products to pre-built infrastructure.
As the core maintainers of DKAN, we provided research-based recommendations and custom data design and development services to make sure the dashboards solved the right problems for agency staff and stakeholders. The project was so successful that the client reached out to us with the intent to create more dashboards to display patient care and underserved areas data.
Build for real user needs
We brought a human-centered approach to the data dashboards, and used the React.js library to build intuitive visualizations. We listened carefully to the desired outcomes, researched user needs, then made suggestions for how people could best learn about the demographic makeup and overall distribution of physicians, physician assistants, and nurses throughout the state.
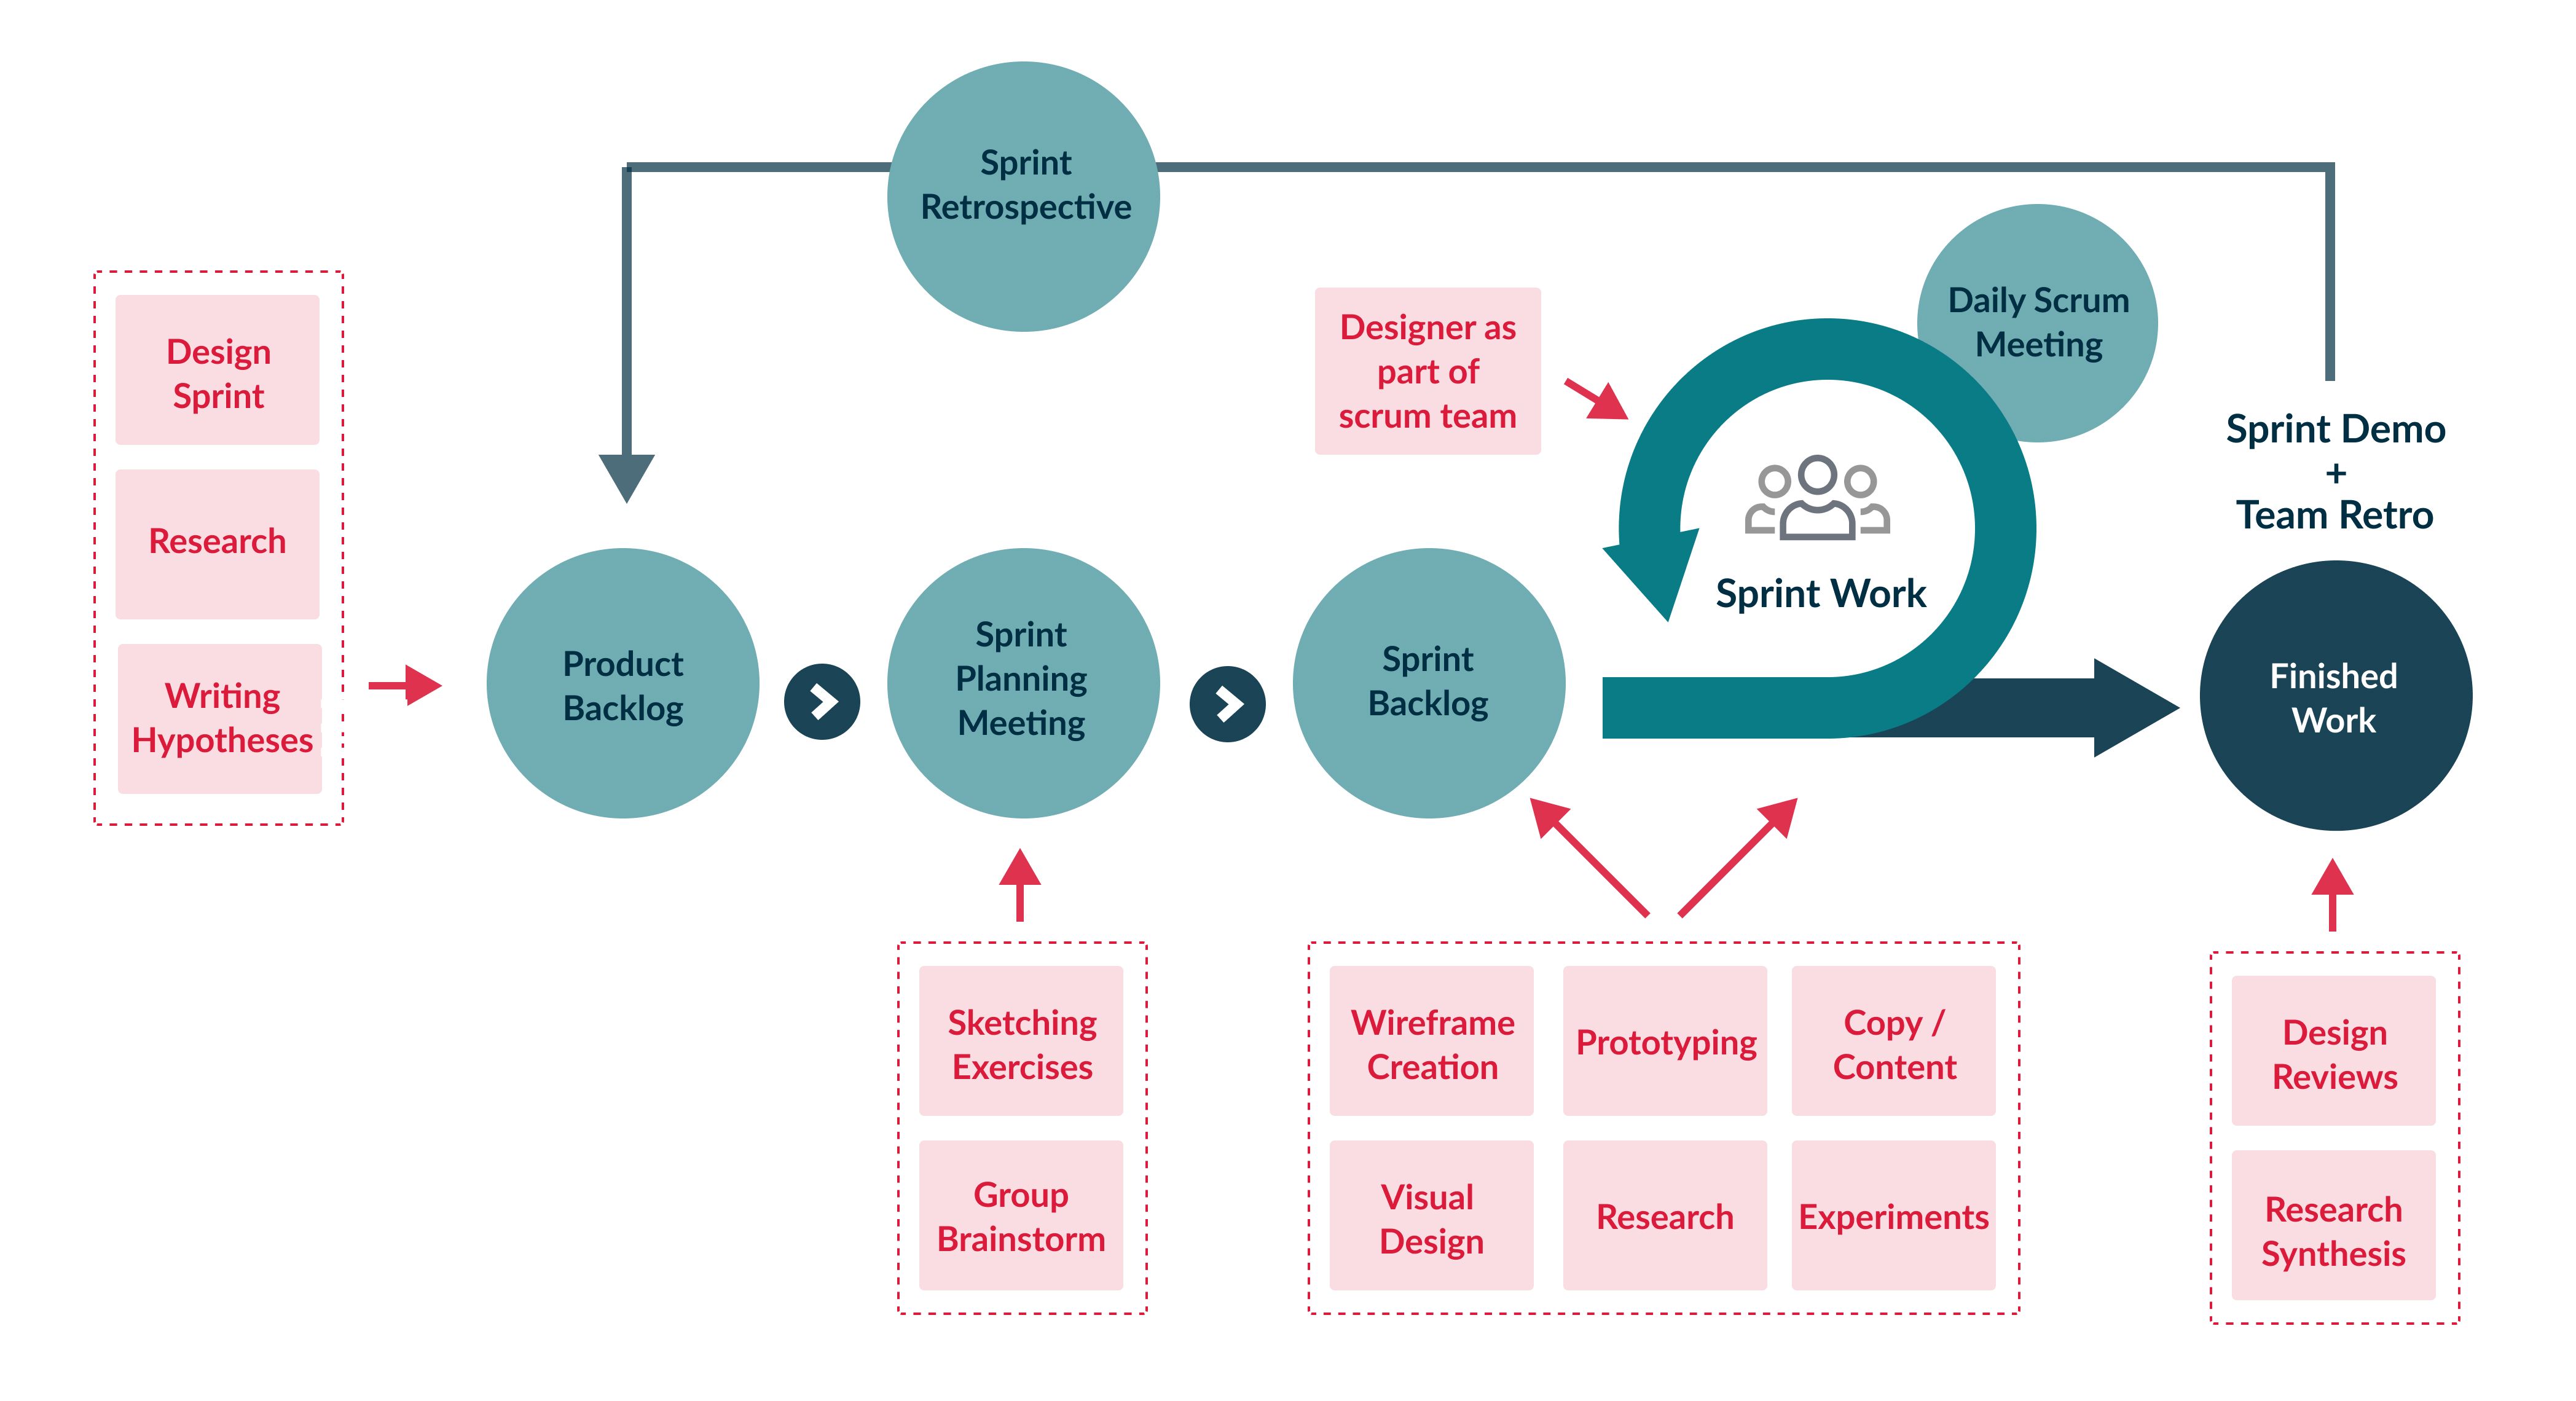
Deliver early and often
For the redesign of the data dashboards, we used agile sprint cycles with daily stand-up meetings to develop and implement small chunks of working software quickly. We used test data provided by GBHCW to create proofs-of-concept, with graphs and charts that made sense of the various elements we knew the client wanted to showcase.
Align and adapt
Meeting regularly with project leaders at the agency ensured that the vision and work remained in alignment. Together we reviewed work that had been done, checked if adjustments were needed, and responded quickly to evolving requests or new data. Staying in close communication ensured there were no surprises and the client goals were met.
Key outcomes
Modern, accessible data
Instead of having to address time-consuming data requests, agency staff can quickly refer people to the live dashboards. Data updates and maintenance are quick and simple, saving time and money for GBHCW.
Serving vulnerable populations
People can view the workforce data by county, specialty, and other identifiers. These geographical differentiations help policymakers and stakeholders identify and remedy gaps in rural health coverage.
Reliable data analysis
The state of Georgia once relied on unpredictable volunteer efforts for analysis of nursing workforce data. Instead, the dashboards see regular analytics and data presentations formalized into existing processes.
Sustainable framework
The agency leveraged an existing open data contract with us, which meant we could utilize the web-based resources needed to make this effort sustainable and efficient for years to come.
Increased resilience
Easy access to data is critical during public health emergencies, such as the COVID-19 pandemic. From awareness campaigns to vaccination efforts, the agency is better prepared to mobilize its health workforce.
Data for public use
The dashboards allow anyone to easily observe workforce trends and create evidence-based initiatives in service of the public, including journalists, nonprofits, advocacy groups, or pharmaceutical vendors.